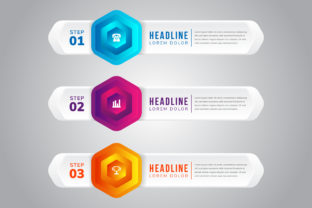
Infographics 3D Hexagon: Clarity, Not Complexity
A well-designed Infographics 3D Hexagon isn’t just eye candy—it’s a structured visual framework that helps audiences grasp interconnected ideas at a glance. Think of it as a six-sided prism for organizing concepts like strategy pillars, skill sets, product features, or sustainability goals. Unlike flat diagrams, its 3D form adds depth—literally and conceptually—making relationships between elements more intuitive. That’s why marketers use it to map customer journeys, educators to visualize learning outcomes, and startups to communicate their value proposition without oversimplifying.
Assuming It’s Just a “Prettier” Version of a Flat Hexagon
Many beginners download an Infographics 3D Hexagon template expecting automatic clarity—only to realize later that the third dimension introduces new challenges. A true 3D hexagon requires thoughtful layering: foreground elements should guide attention, mid-ground supports context, and background elements provide subtle reinforcement—not visual noise. When used carelessly, the “3D” effect can distort proportions, obscure labels, or create unintended hierarchy (e.g., a less important point appearing dominant simply because it’s rendered closer to the viewer).
For example, one small business owner chose a flashy animated Infographics 3D Hexagon for her service page—only to find users scrolling past it entirely. Why? The rotation was too fast, text overlapped during transitions, and mobile rendering clipped key labels. A static, carefully angled version with consistent lighting and legible typography performed 3x better in engagement metrics.
Overlooking Compatibility and Output Constraints
Not all Infographics 3D Hexagon files behave the same way across tools or platforms. A file built in Blender may not render correctly in PowerPoint. An SVG exported from Figma might lose shading depth when embedded in email clients. Even PDF exports can flatten gradients or misalign shadows if transparency settings aren’t optimized.
This matters most when your audience consumes content across devices or mediums—presentations, printed reports, social posts, or web banners. Before finalizing, always test:
- How it looks on a smartphone screen (especially text size and contrast)
- Whether animation works in your target presentation software (not just in the editor)
- If layered effects survive export to PNG or JPG (some 3D filters require rasterization)
- Whether color fidelity holds up when converted to CMYK for print
A freelance designer once delivered a client-facing Infographics 3D Hexagon in high-res PSD format—only to learn the client needed editable vector files for their marketing team. Rebuilding it cost two extra days. Now she confirms file format needs upfront—and delivers both vector (AI/SVG) and raster (PNG) versions by default.
Treating It as a Standalone Solution, Not a Communication Tool
An Infographics 3D Hexagon doesn’t explain itself. Its power comes from how well it aligns with your message—not how many shadows or bevels it has. Yet it’s common to see hexagons crammed with jargon, tiny fonts, or mismatched icons that compete for attention instead of supporting understanding.
Ask yourself: Does each segment answer a clear question? Is there enough white space to let the structure breathe? Are colors used intentionally—not decoratively—to group related ideas or indicate priority?
One educator tried using a vibrant Infographics 3D Hexagon to show six core competencies in a professional development workshop. But learners struggled to connect terms like “adaptive leadership” and “systems thinking” without brief definitions or real-world examples anchored to each face. She revised it: kept the 3D layout but added concise callouts beneath each face, plus a short narrative script for facilitators. Retention improved noticeably.
Misjudging Learning Curve vs. Real-World Use
You don’t need advanced 3D modeling skills to use an Infographics 3D Hexagon effectively—but you do need to know what you’re optimizing for. If your goal is speed and consistency, choose editable templates in tools you already use (like PowerPoint, Canva, or Adobe Illustrator). If you need custom animation or interactivity (e.g., hover effects in a web dashboard), then investing time in learning basic Blender or After Effects makes sense—but only if that matches your actual output needs.
A blogger assumed he’d “level up” his visuals by switching to a premium 3D modeling suite. He spent weeks mastering camera angles and material textures—only to realize his audience mostly sees his content as static thumbnails or newsletter images. He switched back to streamlined Canva templates with pre-adjusted perspective grids and reclaimed 10+ hours per month.
Skipping the “Why” Behind the Shape Itself
The hexagon isn’t arbitrary. Its six sides naturally support balanced, non-linear thinking—ideal for frameworks where no single element dominates (unlike a pyramid or funnel). But forcing unrelated ideas into six slots just to fit the shape weakens credibility. If your model truly has five core components—or eight—consider adapting: use a pentagon, octagon, or even a radial layout instead.
One SaaS team insisted on fitting their seven-value proposition into an Infographics 3D Hexagon. They merged two values awkwardly (“security & compliance”) and diluted both. When they shifted to a clean 3D radial diagram with seven arms, messaging became sharper—and sales conversations flowed more naturally.
What to Check Before You Commit
Before downloading, buying, or building your next Infographics 3D Hexagon, pause and verify these practical points:
- Licensing: Does the template allow commercial use, modification, and redistribution if needed?
- Scalability: Does it retain clarity when resized down to 400px wide (e.g., for social previews)?
- Accessibility: Can screen readers interpret its structure? Are color contrasts WCAG-compliant?
- Editability: Are layers named logically? Are fonts embedded or outlined to prevent substitution?
- Context fit: Does the tone (e.g., playful vs. corporate) match your brand and audience expectations?
Remember: the best Infographics 3D Hexagon doesn’t draw attention to itself—it quietly strengthens understanding. It’s not about adding dimension for dimension’s sake. It’s about giving your ideas room to connect, resonate, and stay memorable—without asking your audience to work harder to get the point.